COVID-19: The fullest data to date has dropped on coronavirus deaths in England and Wales - here's what it tells us
New figures reveal more detail about the number of people who died during the pandemic. Sky News analysis shows how many lost their lives, where most deaths took place, and where there were fewer deaths than usual.
Tuesday 22 March 2022 21:24, UK
Two years since COVID prompted the first UK lockdown, new figures reveal more detail about the numbers of additional deaths that occurred during the pandemic.
Professor Chris Whitty, the chief medical officer, has previously said that excess deaths are the best measure to assess how well or badly the UK has performed.
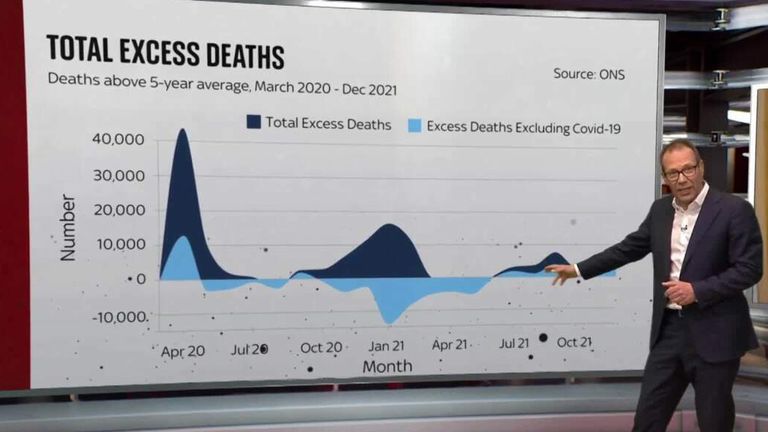
Between March 2020 and December 2021, 133,623 more people died in England and Wales compared to the average from 2015-2019.
More than three in five of those additional deaths were men - more than 80,000 compared with just over 50,000 women.
But if you remove the people who died from COVID, there were actually 7,401 fewer deaths than would be expected during the same time frame. 11,552 fewer women died than the average of 2015-19, but an extra 4,150 men died.
More than a third of those excess deaths occurred in the second month of the pandemic, April 2020, with a smaller peak arriving in January 2021 during the Alpha wave.
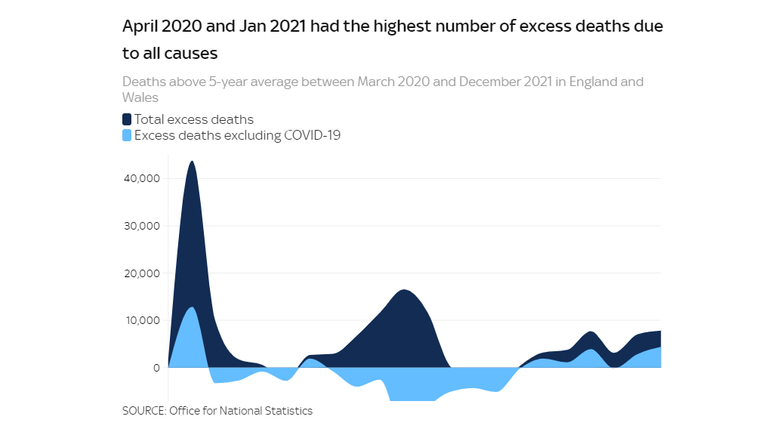
The Office for National Statistics (ONS) describes a phenomenon of 'mortality displacement', in which a period of high excess deaths can be followed by below-average figures, as some vulnerable people die sooner than expected, meaning they don't die in the following weeks or months.
Professor Sir David Spiegelhalter, chair of the Winton Centre for Risk and Evidence Communication at Cambridge University, said "the huge deficit of 30,000 non-COVID deaths in the 2020-21 winter can be attributed both to some deaths being brought forward to the first wave, and to the lack of flu - ONS report 30,000 fewer deaths from diseases of the respiratory system over the pandemic".
Where did most deaths take place?
This map shows the percentage of additional deaths that occurred during the pandemic compared to the average from the five years previous.
Not a single local authority in England and Wales recorded fewer deaths than it would have been expected to, with London the worst affected region. Tap or click on the map to explore rates in your area.
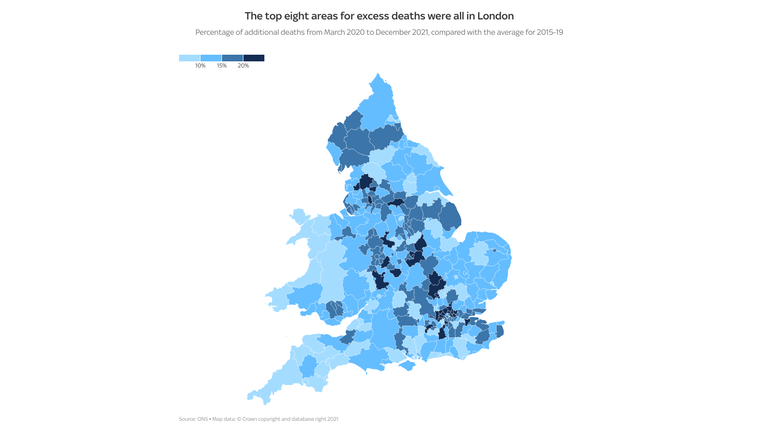
Newham, Brent and Hackney - all in London - were the worst-hit areas, recording 30% more deaths than usual. Barnsley, in South Yorkshire, was the worst affected place outside of London.
Meanwhile Torridge, in North Devon, was the only area not to record any more deaths than would have been expected in normal times.
Urban areas were slightly worse affected than rural overall, but not by a significant amount.
There was also no clear trend in terms of more deprived areas experiencing more deaths. In fact, if you exclude deaths from COVID, more people than expected died in the least deprived areas compared to the most.
How many of the deaths were older people?
There were more deaths than expected in every age group over 25, but there were fewer in younger groups - particularly among children under 10.
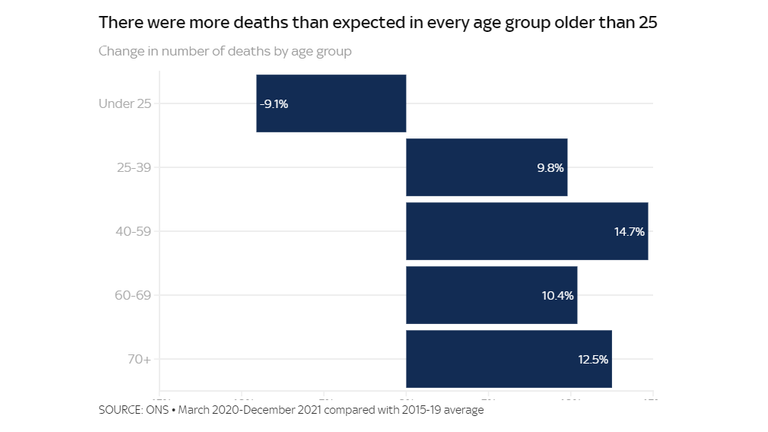
Professor Sir David said "deaths have been both brought forward by COVID, and also delayed by the measures against it".
"Between March 2020 and December 2021, around 800 fewer deaths were recorded in under 30s than would normally be expected - the pandemic was a net life-saver for young people, but this does not mean it is a good thing to lock them up."
Fewer non-COVID deaths in hospitals, more at home
There were fewer non-COVID deaths recorded in hospitals, care homes and hospices than would have been expected during the period.
But the number of people dying at home rose by 75,668 (33%), similar to the fall in people dying at hospital - 74,183 (16%).
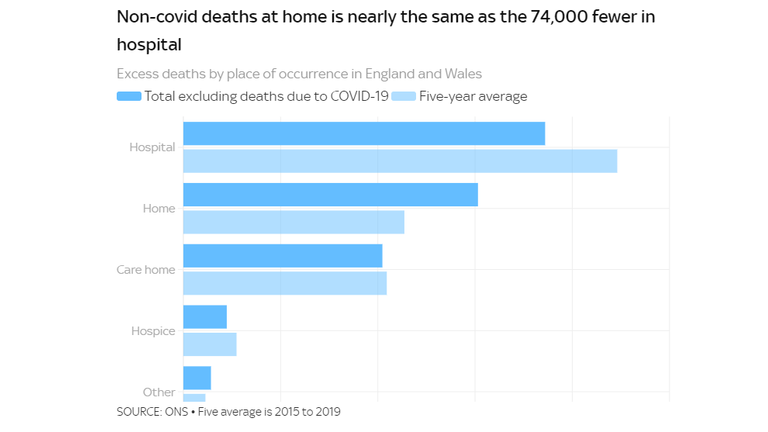
The types of diseases causing extra deaths at home were also the same ones that fell in hospitals and hospices.
For example, there were 8,095 additional deaths at home from heart disease, and 9,253 fewer at hospital. Likewise 7,836 more people died at home from dementia and Alzheimer's, but 9,046 fewer in hospitals.
At hospices, there were fewer deaths recorded from cancers of the lung, colon and prostate, while these all increased at home.
Another potential case of mortality displacement occurred in care homes. There were 7,341 excess deaths from March to December 2020, but 11,872 fewer than expected in 2021.
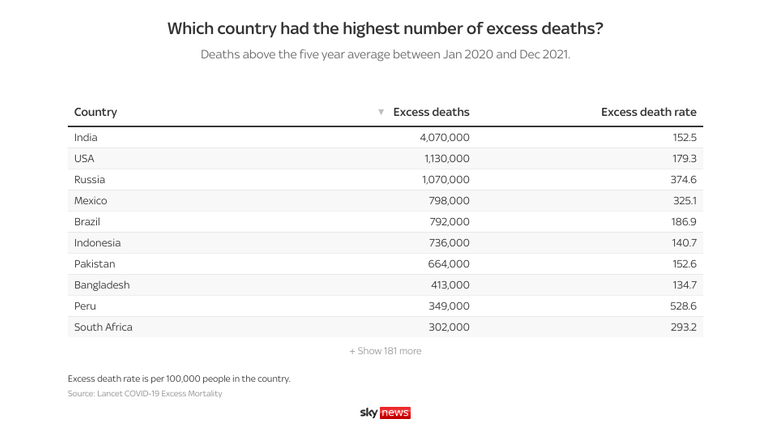
How does the UK compare to other countries?
Using Professor Whitty's theory that excess deaths is the best measure to assess a country's pandemic performance, we can also examine how well other countries have performed in comparison.
Evidence from a peer-reviewed paper published last week in medical journal The Lancet contradicted the idea that the UK was one of the worst-affected countries for COVID deaths.
It estimated that the UK had experienced about 127 extra deaths per 100,000 people from January 2020 to December 2021, than it would have expected to.
The average from the 191 countries evaluated by the paper was slightly lower, at 120 per 100,000, but the UK figure was about the same as average for other high-income countries (126 per 100,000), and lower than the average for western Europe (140 per 100,000).
The figure for the US was just under 180 per 100,000, while there were actually 33 fewer deaths per 100,000 than expected in Australia and New Zealand.
The Data and Forensics team is a multi-skilled unit dedicated to providing transparent journalism from Sky News. We gather, analyse and visualise data to tell data-driven stories. We combine traditional reporting skills with advanced analysis of satellite images, social media and other open source information. Through multimedia storytelling we aim to better explain the world while also showing how our journalism is done.