Texas school shooting: Every US state affected - maps reveal scale of gun violence in America
After the latest in a line of devastating American school shooting incidents, Sky News looks at whether things are getting any better, how the US compares to the rest of the world and if stricter gun control laws might be able to help.
Thursday 26 May 2022 13:02, UK
Less than a decade on from the deaths of 20 children and six staff at Sandy Hook, another brutal gun attack at an American school has shocked the world.
On this occasion, 19 children and two teachers have been killed at Robb Elementary School in Uvalde, Texas.
Tragically, these two incidents are far from isolated or unique.
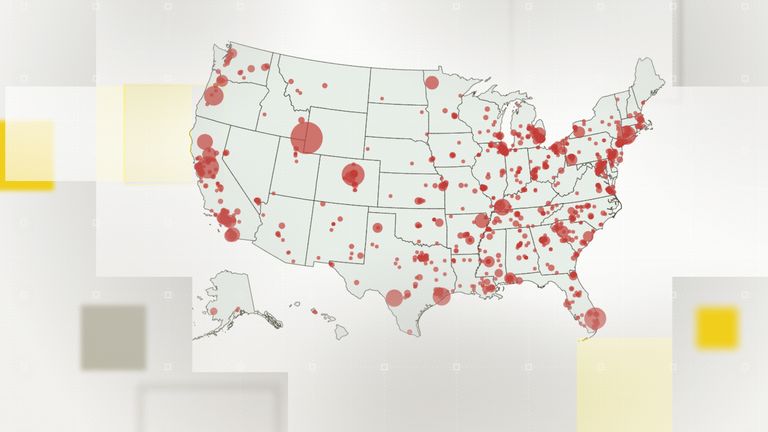
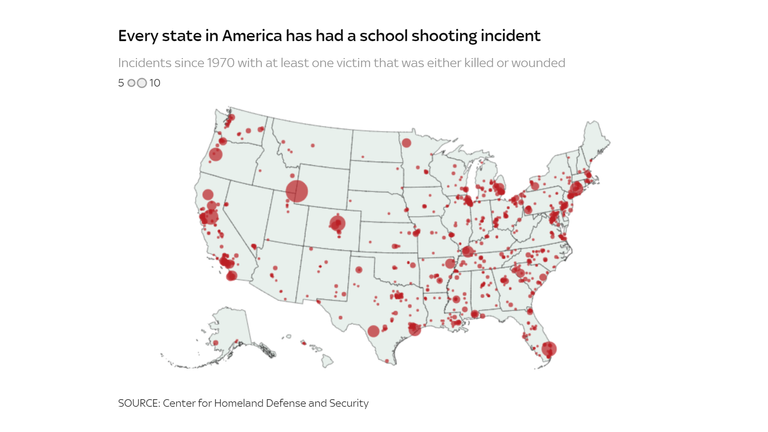
This map shows all the school shootings in the US that have resulted in death or serious injury in the past fifty years.
Click or tap on a dot to see more information about each incident.
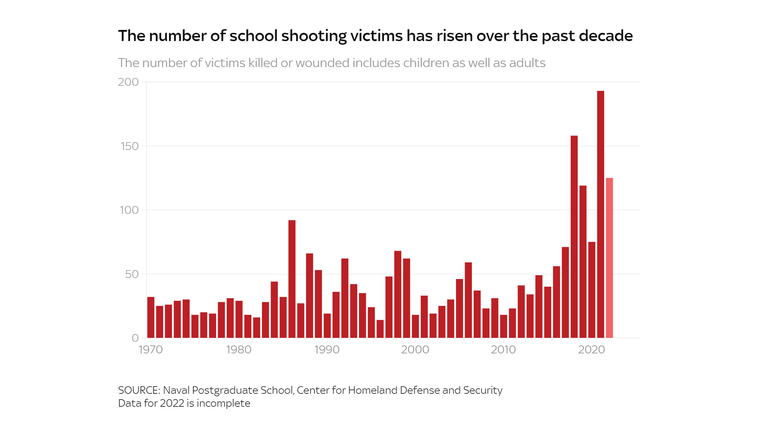
The number of people seriously injured or killed in these incidents has been going up, rather than down, in recent years.
Last year was the bloodiest on record, and 2022 will be even worse if shootings continue at the same rate as they have done this year so far, according to Sky News' analysis of data from the Center for Homeland Defense and Security.
The average for the years from 1970 to 2015 was just under 35 deaths or injuries a year.
Since 2016 that average has trebled to more than 112, despite schools being shut for a portion of that time due to coronavirus.
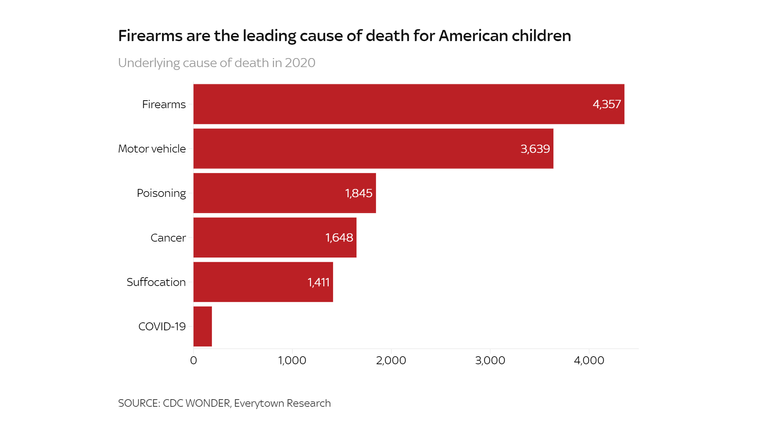
In 2020, children in the US were more likely to die from being shot with a firearm than they were from any other cause of death.
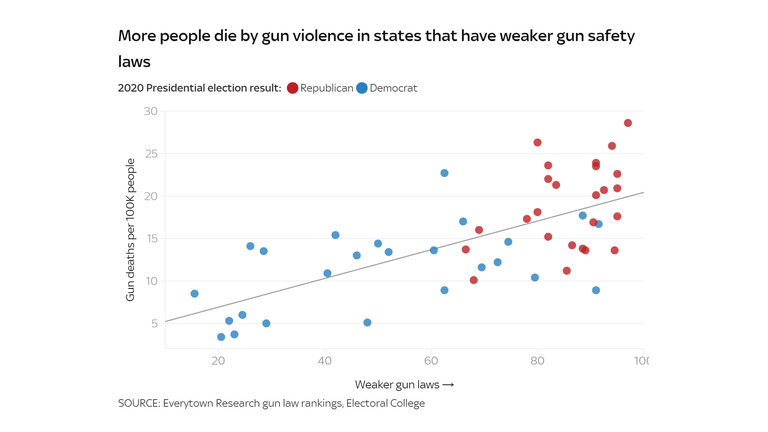
More gun deaths in states where gun safety is weaker
After Sandy Hook in 2012, there were efforts by the then President, Barack Obama, to reform gun control law to try and prevent further incidents.
President Joe Biden, Obama's vice president at the time, has responded to the most recent attack by leading calls to colleagues, 'begging' them to act on gun violence.
The measures put forward ten years ago, to do with stricter background checks on people buying weapons rather than anything close to an outright ban, were voted down in the Senate. President Obama called it a "shameful" day for Washington.
This chart shows how there are more gun-deaths in states where there are looser gun control laws, as defined by Everytown Research and Policy, a non-profit gun control pressure group.
How does the US compare to other countries?
The US is an incredible outlier internationally when it comes to both the number of guns in the country and the number of mass shooting incidents.
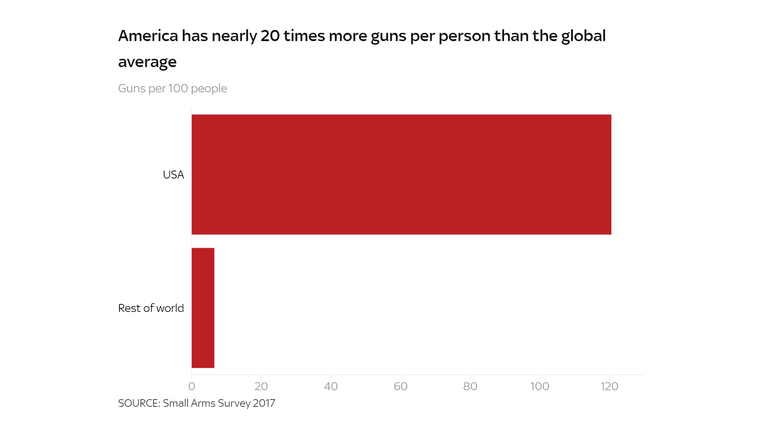
There are nearly 400 million civilian-owned guns in circulation in America - that's more than 40% of the global total and equates to 120 firearms for every 100 people, according to the Small Arms Survey.
The average for the rest of the world is 6 per 100 people.
Just looking at the number of school shooting incidents, research from CNN showed there were 288 recorded in the US between 2009 and 2018.
The country with the next highest number was Mexico, with 8.
Adding together all the incidents from the 26 other major countries they looked at during the study, there were 45.
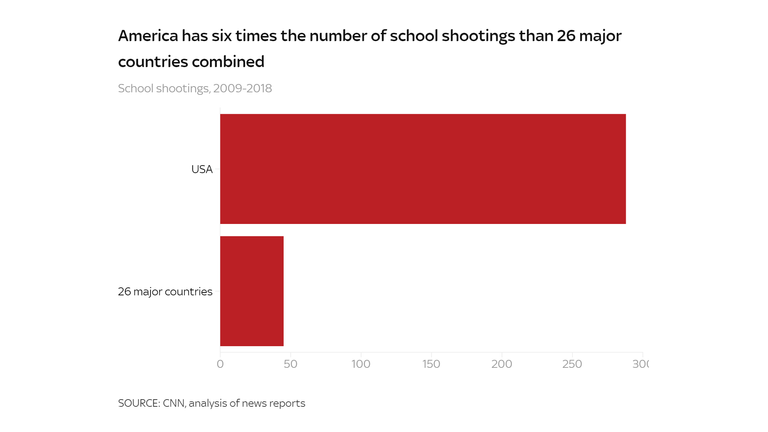
The US population is about 1 in 15 of the total of the countries in the study, but was responsible for 13 out of every 15 school shooting incidents.
The Data and Forensics team is a multi-skilled unit dedicated to providing transparent journalism from Sky News. We gather, analyse and visualise data to tell data-driven stories. We combine traditional reporting skills with advanced analysis of satellite images, social media and other open source information. Through multimedia storytelling we aim to better explain the world while also showing how our journalism is done.